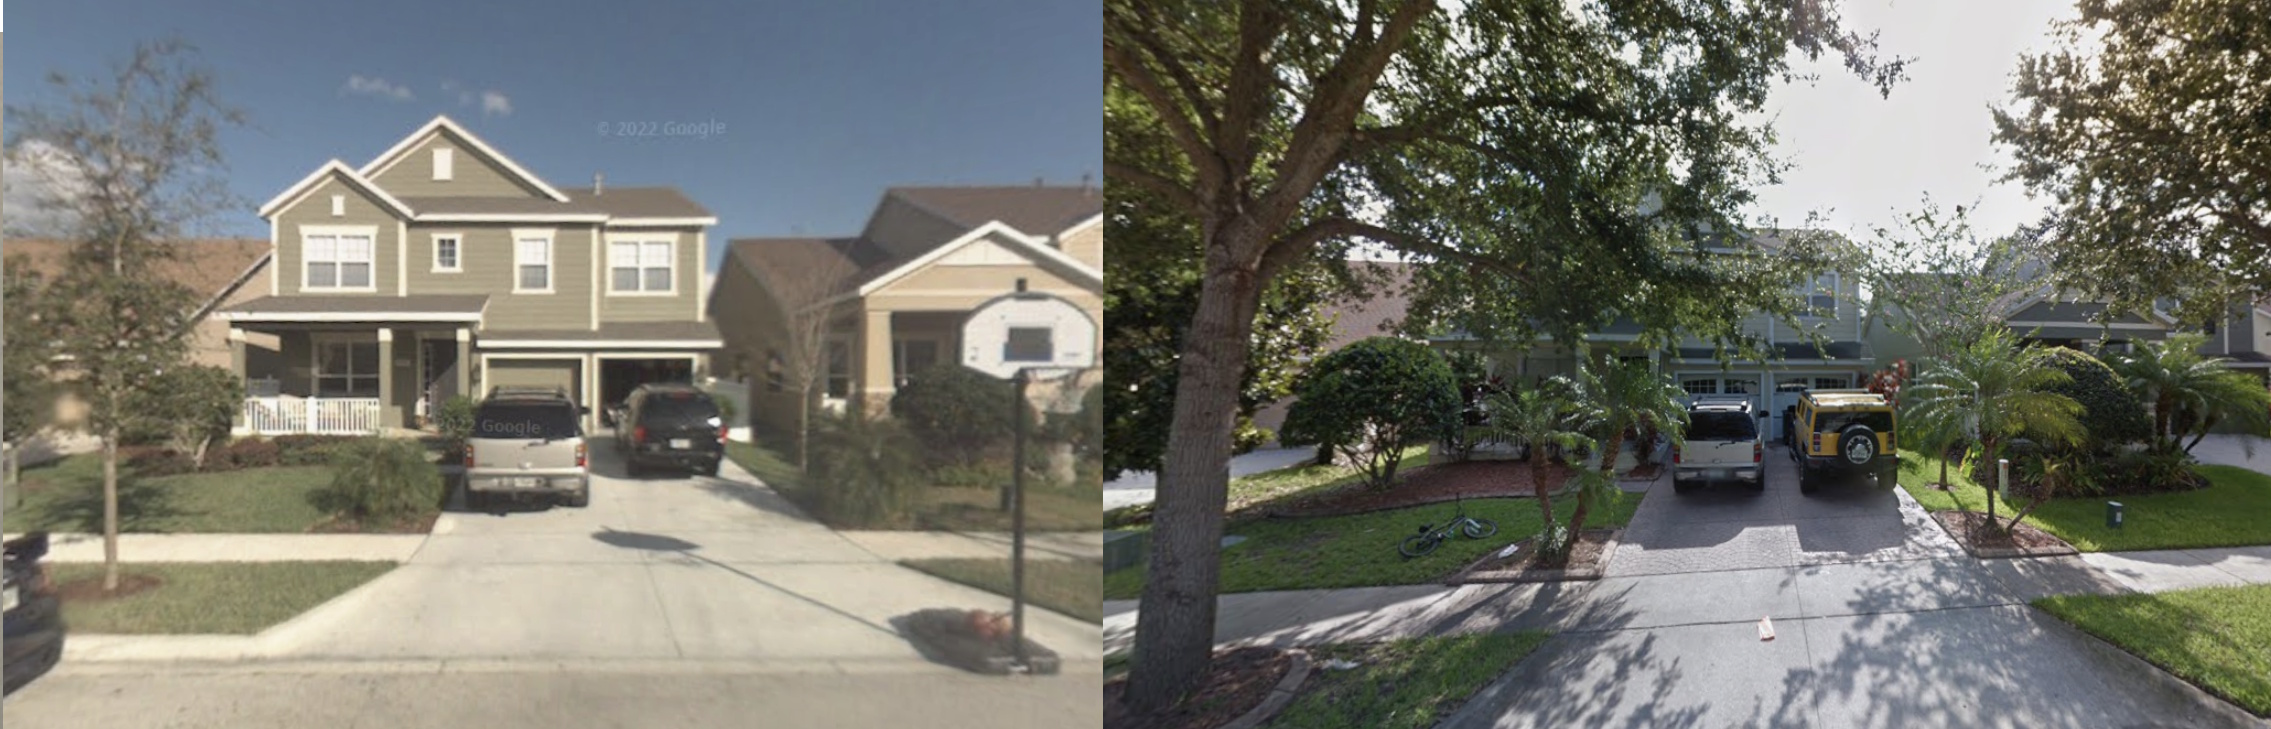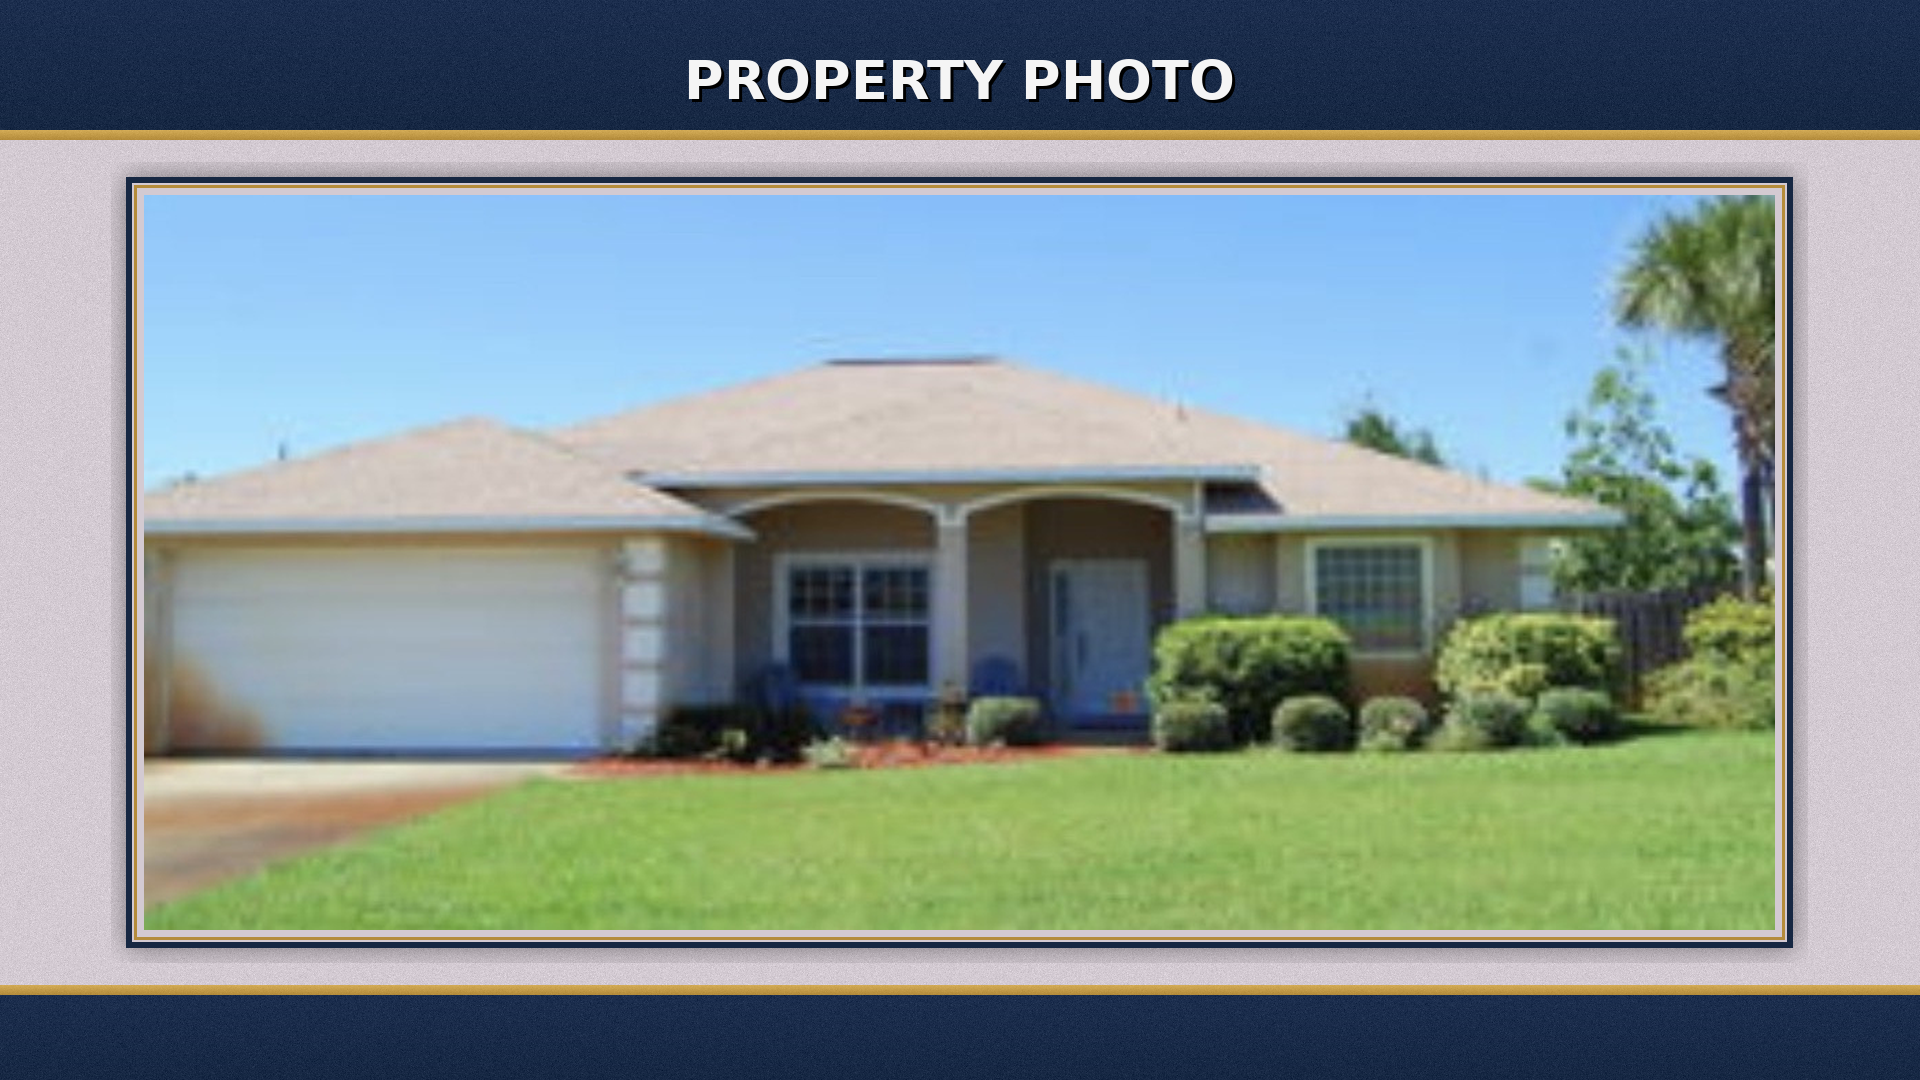
13324 Sunkiss Loop, Windermere, FL 34786
Gross Rent: $2,500.00 /mo
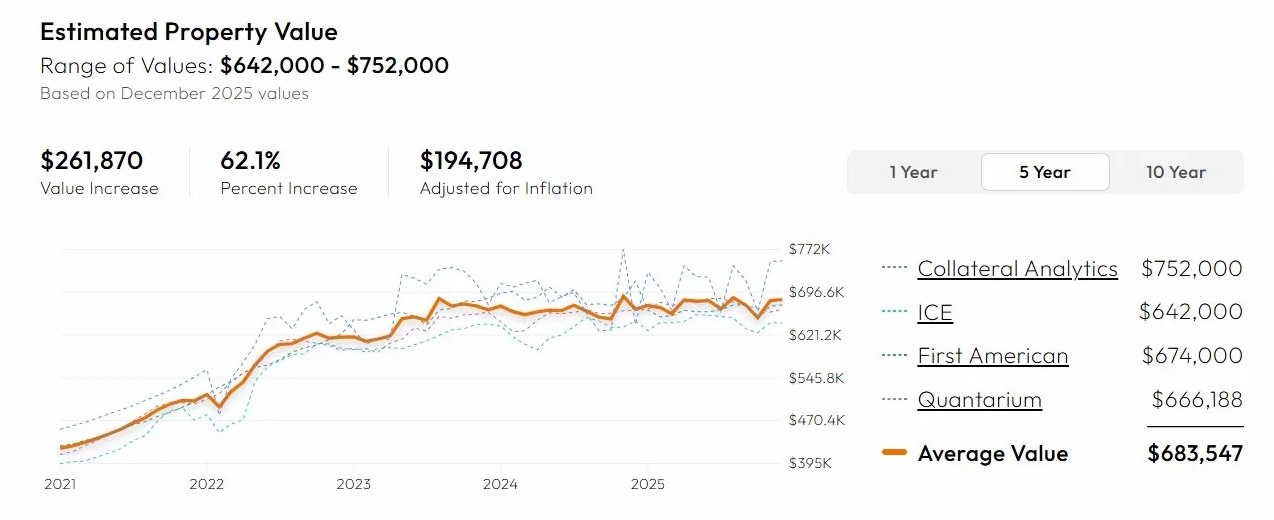
Value: $680,000.00
Lien / Lender
Payoff
Timing / Accrual
1st Mortgage
PHH Mortgage Services
$354,647.83
Good thru 01-31-2026
Interest: $2,792.25 /month (after deadline)
2nd Mortgage
Synergy Consulting LLC
$158,650.00
Good thru 01-31-2026
Daily Interest: $54.17 /day (after deadline)